Project Overview
A global analytics company needed an engaging animated infographic to visualize complex international data for presentations and marketing materials. The infographic needed to be both informative and visually compelling.
The Challenge
Transforming complex global data into an easily digestible, visually engaging animated infographic that could effectively communicate key insights to diverse audiences.
Our Solution
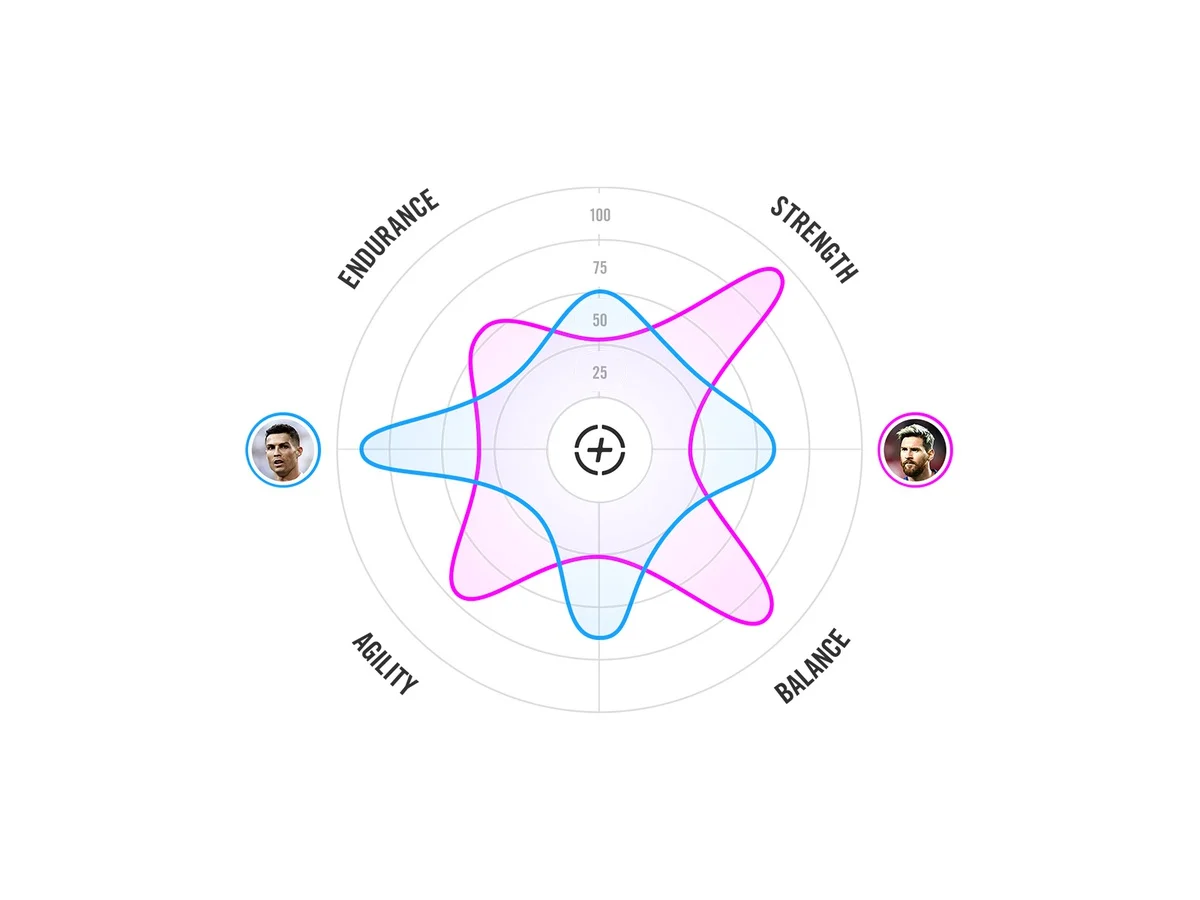
We created a dynamic, animated globe infographic with smooth transitions and clear data visualization. The design uses color coding and motion graphics to highlight key data points while maintaining visual clarity and professional aesthetics.
Results
The animated infographic became a key asset in the company’s presentations and marketing materials, helping them communicate complex data more effectively and engage audiences at conferences and client meetings.
Client Testimonial
“The animated infographic has transformed how we present our global data. It’s visually stunning and makes complex information immediately understandable.”
— Dr. Lisa Thompson, Chief Data Officer, Global Analytics Corp